The concept is pretty simple. It’s like the top program, but instead of CPU and memory usage, it monitors disk I/O. If you have a system that is extremely slow to respond, but can’t seem to figure out what is going on, give iotop a try. You’ll probably have to install it, as I’ve never found a system with iotop installed by default, but it should be in the software repository of just about every Linux distro.
Install iotop
Use the yum command to install iotop under RHEL / CentOS Linux, enter:
# yum -y install iotop
How do I use iotop command?
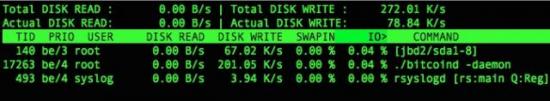
iotop command displays columns for the I/O bandwidth read and written by each process/thread during the sampling period. It also displays the percentage of time the thread/process spent while swapping in and while waiting on I/O. For each process, its I/O priority (class/level) is shown. In addition, the total I/O bandwidth read and written during the sampling period is displayed at the top of the interface.
 However, I recommend that you start iotop with –only option to see only processes or threads actually doing I/O, instead of showing all processes or threads:
# iotop --only
Other supported options by iotop command:
-o, --only
              Only show processes or threads actually doing I/O, instead of showing all processes or threads. This can be dynamically toggled by pressing o.
       -b, --batch
              Turn on non-interactive mode.  Useful for logging I/O usage over time.
       -n NUM, --iter=NUM
              Set the number of iterations before quitting (never quit by default).  This is most useful in non-interactive mode.
       -d SEC, --delay=SEC
              Set the delay between iterations in seconds (1 second by default).  Accepts non-integer values such as 1.1 seconds.
       -p PID, --pid=PID
              A list of processes/threads to monitor (all by default).
       -u USER, --user=USER
              A list of users to monitor (all by default)
       -P, --processes
              Only show processes. Normally iotop shows all threads.
       -a, --accumulated
              Show accumulated I/O instead of bandwidth. In this mode, iotop shows the amount of I/O processes have done since iotop started.
       -k, --kilobytes
              Use  kilobytes instead of a human friendly unit. This mode is useful when scripting the batch mode of iotop. Instead of choosing the most appropriate unit iotop will dis‐
              play all sizes in kilobytes.
       -t, --time
              Add a timestamp on each line (implies --batch). Each line will be prefixed by the current time.
       -q, --quiet
              suppress some lines of header (implies --batch). This option can be specified up to three times to remove header lines.
              -q     column names are only printed on the first iteration,
              -qq    column names are never printed,
              -qqq   the I/O summary is never printed.
keyboard shortcuts for iotop command
- Hit the left and right arrow keys to change the sorting.
- Hit r to reverse the sorting order.
- Hit o only to see processes or threads actually doing I/O, instead of showing all processes or threads.
- Hit p only show processes. Normally iotop shows all threads.
- Hit a display accumulated I/O instead of bandwidth. In this mode, iotop shows the amount of I/O processes have done since iotop started.
- Ht i to change the priority of a thread or a process’ thread(s) i.e. ionice.
- Hot q to quit iotop.