What is atop?
The program atop is an interactive monitor to view the load on a Linux system. It shows the occupation of the most critical hardware resources (from a performance point of view) on system level, i.e. cpu, memory, disk and network.
It also shows which processes are responsible for the indicated load with respect to cpu- and memory load on process level. Disk load is shown if per process “storage accounting” is active in the kernel or if the kernel patch ‘cnt’ has been installed. Network load is only shown per process if the kernel patch ‘cnt’ has been installed.
atop output
To start using atop you need to execute following command as root
# atop
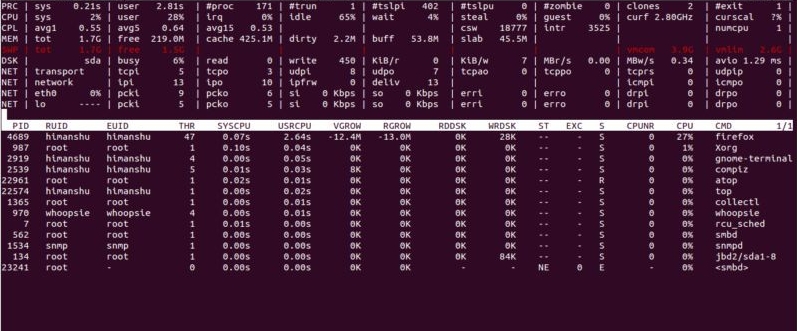
And it will display the interactive screen like this:
IMPORTANT NOTE: When atop is started it starts the process accounting mechanism in the kernel, this forces the kernel to write a record with accounting information to the accounting file whenever a process ends. This means that you must ALWAYS exit atop by pressing ‘q’ or with kill -15, otherwise if you stop it with kill -9 or in any other way that doesn’t allow it to stop the accounting mechanism it will continue generate a huge file on disk.
System level information
The first part of the window shows system level activity, each system resource is shown on a line and it will be displayed only if it had any activity in the last interval (10 second by default).
The lines have the following meaning:
PRC (process) – shows the total cpu time consumed in system (‘sys’) and user (‘user’) mode, total number of processes running (‘#proc’), total number of threads running (‘#trun’), sleeping interruptible (‘#tslpi’), sleeping uninterruptible (‘#tslpu’), number of zombie processes (‘#zombie’), number of clone system calls (‘clones’) and the number of processes that ended during the interval (‘#exit’)
CPU: This line contains the percentage of CPU time spent in kernel mode by all active processes (‘sys’), in user mode (‘user’) for all active processes (including processes running with a nice value larger than zero), for interrupt handling (‘irq’) including softirq, as well as the percentage of unused cpu time while no processes were waiting for disk-I/O (‘idle’) and while at least one process was waiting for disk-I/O (‘wait’). In case of a multi-processor system, an additional line is shown for every individual processor (with ‘cpu’ in lower case), sorted on activity.
CPL (CPU load) – shows the load average figures reflecting the number of threads that are available to run on a CPU, these figures are averaged over 1 (‘avg1’), 5 (‘avg5’) and 15 (‘avg15’) minutes, the number of context switches (‘csw’), the number of serviced interrupts (‘intr’) and
the number of available CPUs are shown.
MEM: This line contains information related to memory consumption — the total amount of physical memory (‘tot’), the amount of memory which is currently free (‘free’), the amount of memory in use as page cache (‘cache’), the amount of memory within the page cache that has to be flushed to disk (‘dirty’), the amount of memory used for filesystem meta data (‘buff’) and the amount of memory being used for kernel malloc’s (‘slab’).
SWP: This line contains the total amount of swap space on disk (‘tot’) and the amount of free swap space (‘free’), the committed virtual memory space (‘vmcom’), and the maximum limit of the committed space (‘vmlim’)
LVM/MDD/DSK (Logical volume/multiple device/disk utilization) – each device will produce one line and it will show the time that the unit was busy handling requests (‘busy’), number of read requests issued (‘read’), number of write requests issued (‘write’), number of MiBytes per second throughput for reads (‘MBr/s’), number of MiBytes per second throughput for writes (‘MBw/s’), the average queue depth (‘avq’) and the average number of milliseconds needed by a request (‘avio’) for seek, latency and data transfer.
NET (Network utilization) – it shows one line for TCP/UDP, one line for the IP layer and one line per active interface.
For the TCP/IP it shows the number of received TCP segments (‘tcpi’), number of transmitted TCP segments (‘tcpo’), number of UDP datagrams received (‘udpi’), number of UDP datagrams transmitted (‘udpo’), number of active TCP opens (‘tcpao’), number of passive TCP opens (‘tcppo’), number of TCP output retransmissions (‘tcprs’) and number of TCP input errors (‘tcpie’).
For the IP layer it shows the number of IP datagrams received from interfaces (‘ipi’), number of IP datagrams that local higher-layer protocols offered for transmission (‘ipo’), number of received IP datagrams which were forwarded to other interfaces (‘ipfrw’), number of IP datagrams which were delivered to local higher-layer protocols (‘deliv’), number of received ICMP datagrams (‘icmpi’), and the number of transmitted ICMP datagrams (‘icmpo’).
For every active network interface it shows the name of the interface and its busy percentage in the first column (‘busy’), number of received (‘pcki’) and transmitted packets (‘pcko’), effective amount of bits received (‘si’) and transmitted per second (‘so’), number of collisions (‘coll’), number of received multicast packets (‘mlti’), number of errors while receiving a packet (‘erri’), number of errors while transmitting a packet (‘erro’), number of received (‘drpi’) and transmitted (‘drpo’) packets dropped.
Process level information
In the second part of the application, the processes are shown from which the resource utilization has changed during the last interval. These processes might have used cpu time or issued disk or network requests.
You can control the output of the atop command from your keyboard. For example, press m to show memory related output, d for disk-related output, n for network related output, v for various process characteristics, c for the command line of the process, etc.
Conclusion
Atop is a very useful load monitoring command in Linux that not only provides a bucket-load of information about system resources but also various ways to customize and control its output. Check man pages for more information.